WordPress is one of the most widely used web development frameworks, and one of the primary reasons behind the WordPress’s popularity is that it enables the users to easily customize the websites and make the sites look exactly the way they want without requiring to possess the coding or programming knowledge.
One can easily enhance the WordPress posts, pages or widgets with various elements to augment the appeal of the website or to deliver better user experience. Among the various elements that can be added to the website are the “Google Charts” that offer an incredible way to represent the data in a visually appealing and easy to understand manner.
What Are Google Charts?
Google Charts is an incredible way to add the information in a tabular format in your WordPress post, page or widget. There are many scenarios, where the best way of presenting the information is either a graph, a pie chart or a bar graph.
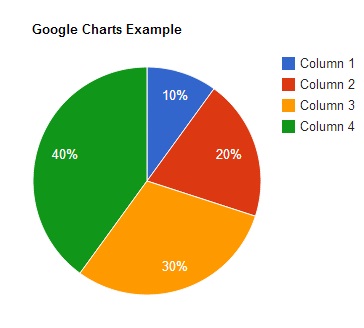
The Google Charts functionality allows you to create the customized chart in an easier manner. Whether you need a simple linear chart or want to add the complex hierarchical tree maps, the Google’s chart gallery can solve your problem. Here you can find an array of ready to use charts and graphs, which can be customized as per your requirements.
The Google charts are highly interactive, and let you present the information in a visually attractive manner. Google enables you to access the chart with a default appearance, and you can easily customize a chart to make it match the look and feel of your website.
The Google Charts can easily be embedded to a WordPress website’s posts, pages, and even widgets. You can easily create a chart in the Google Developer tools and then embed it to the WordPress website elements.
How To Embed Google Chart Into your WordPress Posts, Pages or Widgets?
This guide presents the step by step instructions to embed the Google Chart into your WordPress website elements.
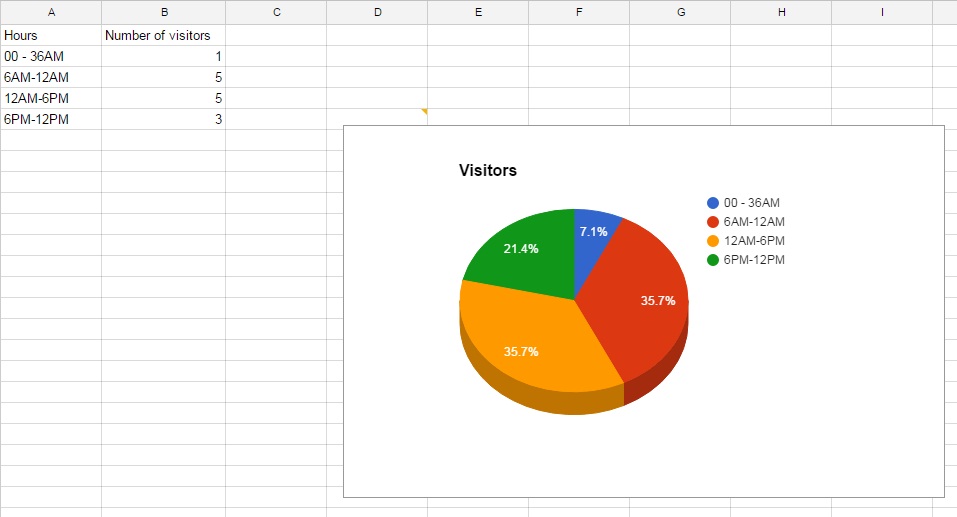
1. First of all, navigate to the Google Developers Charts link, draw your chart and open your Google Spreadsheet with the chart that you want to embed into the WordPress post.
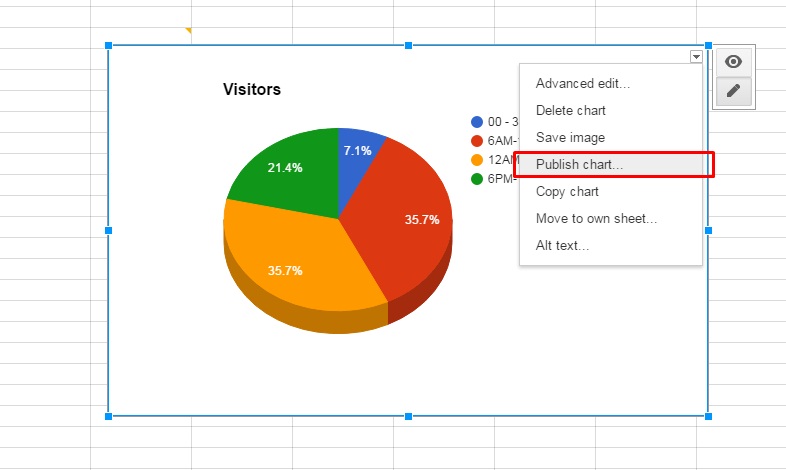
2. Click the “Chart” menu present in the upper right corner of the chart frame, and click “Publish Chart”.
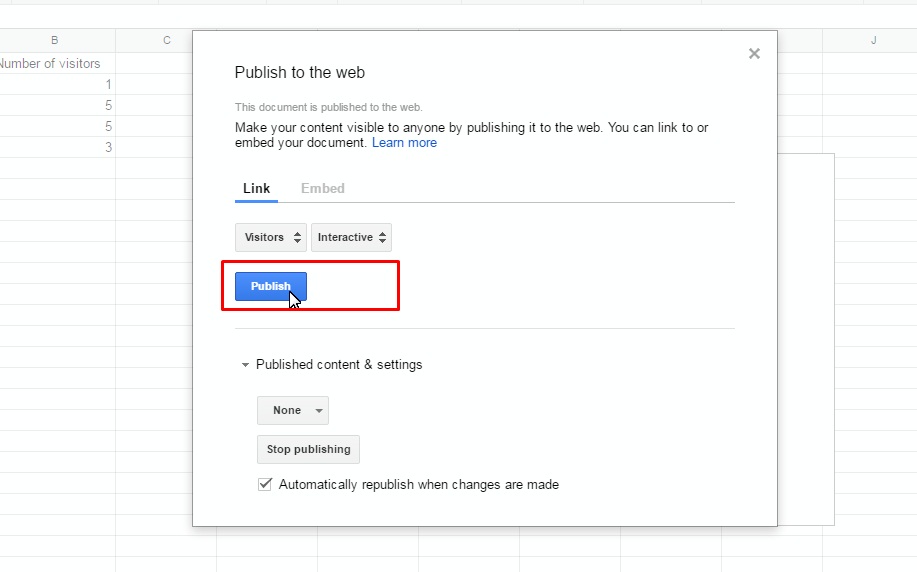
3. Click “Publish”
 4. Now a screen with the HTML script will appear, click the “Embed” tab on this screen.
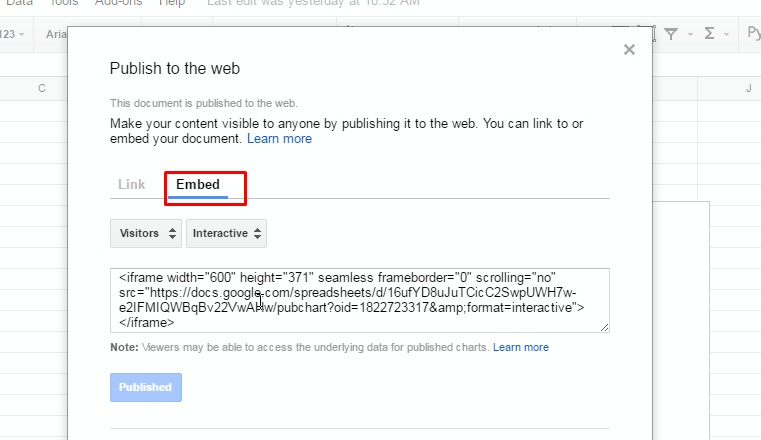
5. Copy this script and paste it into the widget, page or post on which you want the Google Chart to appear. Ensure that you open the page, post or widget in the Text view, and save the changes.
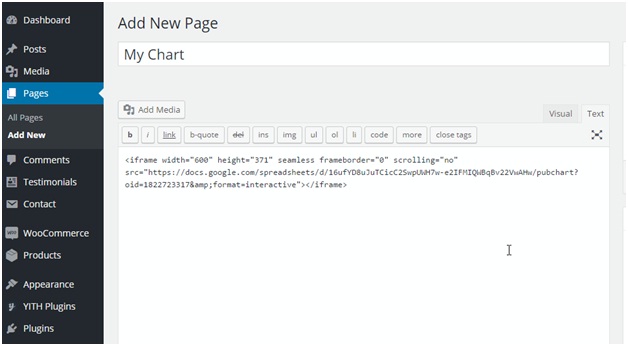
6. Now you would be able to see the chart on your website.
This way, you can easily add the Google charts to your WordPress website and present the information in a way that your visitors find it engaging and easy to understand.